Main Facts & Stats

  • Number of arrivals in Kosovo during 2018 was +795K from 166 different countries
  • Majority of international tourists are from Central Europe, UK and USA
  • Accommodation occupancy rate in 2018 averaged 53.90%
  • Average guests per day in restaurants during the year 2018 was 232 guests
  • Attractions achieved +200K visitors in 2018
Source: Kosovo Tourism Supply Side Survey 2018 done by Promoting Private Sector Employment Project (PPSE) & Kosovo Agency of Statistics

Accommodation-Occupancy Rate 2017 vs 2018

In 2018, the occupancy rate of this category averaged at 53.9 percent, with the lowest rate taking place in February (40.0 percent) and the highest in August (72.8 percent).


Accommodation-Guests and their behaviors

Findings reveal that in 2018 internationals (mostly from Germany and the US) comprised half (50.8 percent) of all visitors in these accommodations; domestic visitors (with more than 20 min. of travel), 19.8 percent; diaspora, 17.5 percent; and locals, 11.9 percent. To compare data with 2017, refer to Figure 19. The number of nights spent averaged at 3.1 in 2018, compared to 3.2 in 2017


Accommodation-Occupancy Rate by Region

Of the top three regions in Kosovo, Peja Region turned out to have had the highest occupancy rate in both years. This was the case in 2017 as well (see Figure 4).


Restaurants- General Structure

In 2018, Prishtina dominated, with 51.4 percent of all restaurants, followed by Peja (24.2 percent), Prizren (5.3 percent) and Ferizaj (5.1 percent). To make a comparison with 2017, see Figure 27.


Restaurants-Number of Guests

The findings disclose that restaurants had 231.8 guests per day, on average, in 2018. During this year, the busiest months turned out to be July and August, with an average of 319.0 and 357.9 guests per day, respectively


Restaurants-Composition of Guests

The findings reveal that 56.6 percent of the clientele in restaurants consisted of locals; others included diaspora (19.7 percent), domestic visitors (15.1 percent) and internationals (8.6 percent). To make a comparison with 2017, see Figure 29. The data on restaurants show that in 2018, 62.1 percent (65.0 percent in 2017) of all guests went to restaurants for food and drinks, while the rest for drinks only. The average expenditures per serving of the former group amounted to 7.1 EUR (7.2 EUR in 2017), while the average of the latter stood at 2.5 EUR (1.9 EUR in 2017).


Attractions- Number of Visits

There has been an increasing number of visitors in tourist attractions over the last three years, from 178,940 in 2016 to 213,800 in 2018. Note that these figures were taken from the interviewed attractions only. As such, they do not show the overall number of visits in the country, but only an indication of the trend. This is because there was no available information on the exact population landscape.


Attractions- by Origin of Visitors

In 2018, the structure of visitors in attractions was dominated by internationals with 41.9 percent, followed by diaspora with 29.2 percent, and domestic visitors (those that travel more than 20 km) with 28.9 percent. A further analysis of the findings reveals that Germans, Albanians, Americans and Turks made up the majority of visitors in 2018 (to compare with 2017).


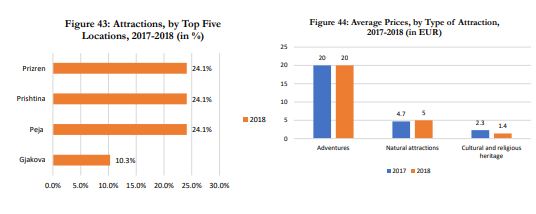
Attractions- Location & Price

In 2018, the majority of attractions across Kosovo were concentrated in Prizren, Prishtina, and Peja, each comprising 21.4 percent of visitors, see Figure 43. Average prices varied, depending on the type of attraction: adventures, 20.0 EUR; natural attractions, 5 EUR; cultural and religious, 1.4 EUR. To compare with 2017, see Figure 44.

For more detailed information